
Strategic TCO Analysis & Software Rationalization
We audit your software stack to prune unused licenses, right-size expensive subscription tiers, and build simple internal tools whenever off-the-shelf software or costly 'AI add-ons' fall short.
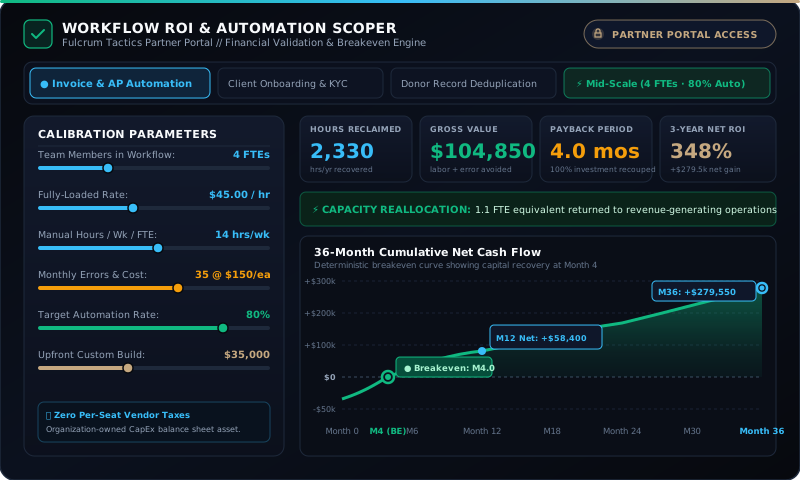
Financial Scoping Engine • CapEx vs. OpEx Modeling • Payback Analysis
The Escalation Math
A $6,000/mo SaaS platform contract with a standard 10% annual escalator and 15% headcount expansion totals over $275,000 in cash outflow over 36 months — leaving you with zero equity when the contract ends.
Vendor Backlog Escapes
Off-the-shelf software vendors build for the lowest common denominator across 10,000 customers. Your custom workflow requirements languish in their feature backlog for 18 months while your staff uses manual workarounds.
Full IP & Code Transfer
Every tool, microservice, and workflow we build for your organization is handed over with 100% intellectual property ownership, complete unit tests, runbooks, and zero ongoing vendor license royalties.
3-Year SaaS Tax vs. Ownership Calculator
Compare what you will pay in compounding SaaS subscription fees against a one-time capitalized build.
90-Day Cash Runway & Stress-Test Simulator
Model how accounts payable payment terms, software OpEx rationalization, and unexpected revenue shocks impact your firm's cash depletion trajectory over the next 12 weeks.
Shifts AP vendor disbursements from Net-30 to Net-45/60, eliminates duplicate payment leakage, and converts redundant SaaS seat tiers into capitalized organization equity (+18.5% burn preservation).
Your cash position provides adequate cushion against a 20% revenue contraction. FT working capital optimization preserves an additional $42,500 over 90 days.
Own Your Systems. Own Your Future.
Schedule a 30-minute executive briefing with our Systems Architects. We will review your current tool stack, audit your licensing contracts, and deliver an empirical build-vs-buy report.
Request a 3-Year TCO & Stack Rationalization Audit